18.1 Ideal Gas Laws and Molecular Interpolation #
Ideal Gas Law Assumptions #
- There are a large number of molecules, .$N$, each of mass .$m$ that move in random directions at random speeds
- Molecules are, on average, sufficiently far away from one another (separation .$\gg$ diameter)
- Molecules obey classical mechanics so .$KE \gg PE$ when colliding
- Collisions are perfectly elastic
Micro and Macroscopic views related through Energy #
- In a system with .$N$ molecules each of mass .$m$ and average speed .$\bar{v}^2$ (also denoted as .$\langle v^2 \rangle$), we can combine the ideal gas law with the .$\overline{KE}$ equation:
$$\overline{K} = \frac{1}{2} m \bar{v}^2 = \frac{3}{2}k_B T$$
- This shows .$\overline{KE} \propto T$ which makes sense intuitively; cold = slow particle motion
- E.x: A container is filled with a light and heavy molecule. Which has a greater speed? The lighter molecules do because they are less massive.
- And since the system’s internal energy .$E_{\text{int}} = N \cdot \overline{K}$ then we can write an important .$PV$ relation + find the gas.$E_{\text{int}}$: $$T = \frac{\frac{1}{2} m\bar{v}^2}{\frac{3}{2}k_B} = \frac{2}{3} \cdot \frac{E_{\text{int}}}{N k_B} \Longrightarrow PV = \frac{2}{3}E_{\text{int}}$$ $$E_{\text{int}} = N\cdot \frac{1}{2}m\bar{v}^2 \Longrightarrow PV = \frac{Nm}{3}\bar{v}^2 $$
- Which shows us that .$(P,V)$ is a representation of (kinetic) energy!
- We can think of any point on a .$PV$ diagram in terms of energy
Absolute 0 #
Before, we said .$T = 0K$ exists when .$P = 0$
Now we can also see that .$KE = 0$ when .$T = 0$ as well. This would mean that at absolute 0, there is no particle movement
We can then write an equation for the root-mean-square (or RMS): $$\overline{K} = \frac{3}{2}k_B T \Longrightarrow \frac{1}{2}m\bar{v}^2 = \frac{3}{2}k_B T;\ v_{\text{rms}} = \sqrt{\bar{v}^2} = \sqrt{3k_B\frac{T}{m}} = \sqrt{3 R\frac{T}{M}} $$ $$\bar v ^2 = \frac{1}{N}\sum_i^N n_i v_i^2 \Longrightarrow v_{\text{rms}} = \frac{1}{\sqrt N} \sqrt{\int_0^\infty n(v)\cdot v^2 dv} $$
- This is the typical velocity of particles that make up the gas/liquid
- .$M$ is the molar mass of the gas [kilograms per mole]
- .$v_{\text{rms}}$ is also called the thermal velocity, .$v_{\text{th}}$
- Fun fact: Less than 1% of particles of particles exceed .$v_{\text{rms}}$
- Example problems:
- If a sample is quasistatically shrunk to half it’s original volume with no change in pressure, the new root-mean-square speed is .$1/\sqrt{2}$ times the original rms speed
- If we double the root-mean-square speed (thermal speed) of the molecules of a gas, then its temperature must increase by a factor of 4
18.2 Distribution of Molecular Speeds #
$$f(v) = 4\pi N \bigg( \frac{m}{2 \pi k_B T}\bigg)^{3/2} v^2 e^{ -\frac{1}{2} \cdot \frac{mv^2}{k_B T}}$$
- Recognize that .$f(v) \propto T^{-3/2}, v^2$ and exponentially .$\propto KE/T$
- If .$T$ increases, so does .$KE$ and .$v$ thus variance .$\sigma^2$ increases and the distribution becomes “stretched” (lower max, thicker tail)
- Spread of important values (.$v_p, v_{\text{avg}}, \text{etc.}$) are spread out further from one another
- Area stays constant (always equal to .$N$)
- .$f(v)\ dv$ represents the number of molecules with .$v \in [v, v+dv]$
- That is, .$\int_0^\infty f(v) dv = N$
- .$\sigma^2$ is the variance, or standard deviation squared, which can be found from the equation .$\langle v^2 \rangle - \langle v \rangle ^2$
- Chemical Reactions
- Some reactions only occur at a certain energy levels (activation energy)
- Warmer conditions lead to faster moving particles which have energy
- That’s why reaction speed .$\propto$ temperature
Important Values #
$$v_p = 1.41 \sqrt{k_B\frac{T}{m}}$$
$$v_{\text{avg}} = 1.60 \sqrt{k_B\frac{T}{m}}$$
$$v_{\text{rms}} = \sqrt{3 k_B \frac{T}{m}}$$
- Notice how .$v \propto m^{-1/2}$, which explains why it’s easier for lighter particles to escape earth’s atmosphere!
18.3 Real Gases and Phase Changes #
(a) Each curve represents the relationship between .$P$ and .$V$ at a fixed temperature; the upper curves are at higher temperatures. The lower curves are not hyperbolas, because the gas is no longer an ideal gas. (b) An expanded portion of the diagram for low temperatures, where the phase can change from a gas to a liquid.
- Phase changes can only be explained if we’re considering the behavior of a real – not ideal – gas
- This is because phase changes involve intermolecular bonds which we only factor in when considering real gases
- At high enough pressures, gases take up less volume than expected.
- This effect is magnified with lower temperatures
- At lower temperatures, the .$PE$ attractive forces between particles aren’t negligible with respect to .$KE$
- At the critical points (when .$PV$ curve is horizontal), gases may no longer change to liquid under any pressure
- This point varies by substance
- Gas below the critical point is vapor
- Gas above the critical point is just gas
- Sublimation: When substance changes from solid to gas, skipping liquefaction step
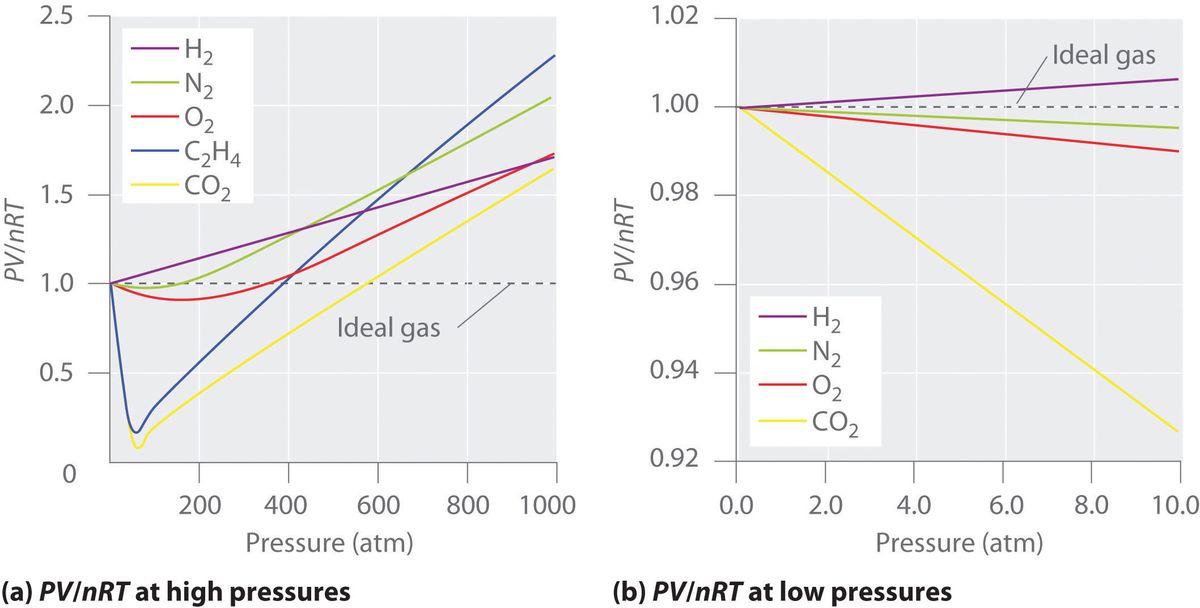
- Ideal gases would have a straight line along a .$PV/nRT \text{ vs } P$ graph
- Real gases vary don’t follow this line and deviate from it proportional to their molecule size and weight (resulting in higher .$a$ and .$b$ values respectively – see 18.5)
18.4 Vapor, Pressure, and Humidity (not covered) #
Evaporation #
- Molecules in liquid are held tightly together with intermolecular attractive forces (covalent hydrogen bonds)
- Some molecules may momentarily leave the liquid if their velocity is fast enough
- If velocity isn’t too large, then the particle will be pulled back to the liquid surface
- If velocity is large enough, then the particle will break the intermolecular bonds and leave the liquid to enter their gas form
- Low probability of occurring
- Because .$v_{\text{particle}} \propto T$, the .$\text{evaporation rate} \propto T$
- As fast moving (thus hot) particles leave the liquid, the liquid’s temperature decreases
- That is, evaporation is a cooling process
Vapor Pressure #
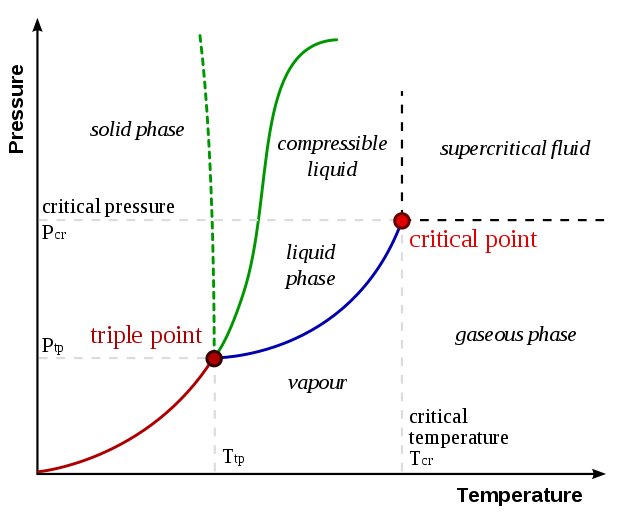
A typical phase diagram. The solid green line applies to most substances; the dashed green line gives the anomalous behavior of water
- Green line = SL Line; transition between solid .$\iff$ liquid (melting/freezing)
- Red line = SV; transition between solid .$\iff$ vapor (sublimation/deposition)
- Blue line = LV; transition between liquid .$\iff$ vapor (vaporizing/condensing)
- When evaporation particles go from gas to liquid, it’s called condensation
- The number of particles in vapor increases until the rate of particles condensing is equal to the number of particles becoming vapor (equilibrium!)
- When this state is reached, the space above the water is considered saturated
- Pressure of vapor saturation is called (saturated) vapor pressure
- Saturated Vapor Pressure varies with the volume of container
- If volume above the liquid was reduced, then the density would increase so particles would condense back to liquid
- Assuming .$T$ is constant, vapor pressure would stay constant too
- Since at high temperatures there are more particles (entering/already in) the vapor phase, higher pressure is required for equilibrium
- When the volume is large, it’s likely that all the liquid evaporates before equilibrium
Boiling #
- Boiling occurs when saturated vapor pressure equals external pressure
- Bubbling forms as temperature approaches boiling temperature
- If the pressure in the bubbles are less than the external pressure, the bubbles are crushed
- Otherwise, bubbles are able to rise to surface
- Boiling point is proportional to pressure
- Lower pressure = lower temperature required for boiling point
Partial Pressure and Humidity #
- In gases composed of multiple other gases, the total pressure is the sum of all partial pressures for each of other sub gas
- Partial Pressure is the pressure a single gas would exert by itself
- The partial pressure of water in the air can be as low as zero and vary up to a maximum equal to the saturated vapor pressure (of water at the given temperature)
- Relative Humidity: ratio of partial pressure of water vapor to the saturated vapor pressure at a given temperature $$\text{Relative Humidity} = \frac{\text{partial pressure of }H_2O}{\text{saturated vapor pressure of }H_2O} \cdot 100\%$$
- Super Saturation: .$P_{\text{partial}} > P_{\text{saturated vapor pressure}}$
- Happens when temperature decreases
- Excess water condenses as dew / mist
18.5 Van der Waals Equation of State #
Microscopic (molecular) view accounts for…
- Finite size of molecules (before we assumed separation .$\gg$ diameter, ignoring density)
- Since gas particles aren’t negligible in size, we can’t use all of our volume
- Particles are solid spheres that can’t get closer than .$2r$ to one another
- That means .$V$ is over-estimated: .$V_{\text{real}} < V_{\text{ideal}}$
- Lower volume mean more collisions, leading to pressure being higher than estimated with the ideal gas law: .$P_{\text{real}} > P_{\text{ideal}}$
- The unavailable volume due to particles, .$b$, depends on the .$n$umber of moles $$ P(V-nb) = nRT \Longrightarrow P\bigg(\frac{V}{n} - b\bigg) = RT\ \ \ \big[\text{Clausius Equation of State}\big]$$
- Where .$b$ is the volume consumed by 1 mol of gas with the units .$\text{V/mols}$
- Forces between molecules (before we assumed that forces only played an effect in collisions)
- At low .$T$, electric attractive forces aren’t 0
- Particles towards the edge are slowed down by the other particles attractive forces
- For that reason, our pressure is lower than estimated with the ideal gas law: .$P_{\text{real}} < P_{\text{ideal}}$
- On the contrary, with higher temperatures gases appear more ideal because .$KE$ is greater than the intermolecular .$PE$
- “Slow down” is proportional to the gas density
- M ore dense means more molecules means more intermolecular forces
- Pressure reduced by the following equation where .$n/V$ is the gas density and .$a$ is a constant unique to the gas that measures the attractive forces between particles $$ a\bigg( \frac{n}{V}\bigg)^2$$
- .$a \propto m$ and boiling point because the lower the boiling point, the less energy is required to break the internal bonds
- At low .$T$, electric attractive forces aren’t 0
- Thus, we can rewrite the ideal gas law with the last two equations as
$$ \bigg(P+ \frac{a}{(V/n)^2}\bigg)\bigg(\frac{V}{n} - b\bigg) = RT \ \ \big[\text{Van der Waals Eq of State}\big]$$
- Note that these equations aren’t accurate in all cases, but they’re the best generalization we can do and they show the relation
- With low densities, .$a\big/(V/n)^2 \ll P$ and .$b \ll V/n$ so Van der Waals equation reduces to the ideal gas law
18.6 Mean Free Path #
- Molecules bump into each other a lot which slow them down
- Mean free path: Average distance between collisions is proportional to .$\rho ^{-1}, r^{-1}$ $$l_m = \frac{1}{4\pi \sqrt{2}r^2 (N/V)}$$
18.7 Diffusion (not covered) #
- Particles diffuse from high to low concentrations until equilibrium is reached (when .$\rho$ is constant throughout)
- Given a tube with a cross section area .$A$, two concentrations, .$C_1$ and .$C_2$, separated by .$\Delta x$, we can write the rate of diffusion, .$J$, as $$J = DA \frac{C_1 - C_2}{\Delta x} = DA \frac{dC}{dx} \ \ \text{[Fick’s Law]}$$
- .$D$ is the diffusion constant
- Varies with temperature, viscosity, and particle size